
Understanding the Analytics Page
What is this page?
Section titled “What is this page?”The Analytics page helps you monitor your store’s performance. It shows traffic data, revenue insights, and user behavior so you can make better decisions.
Analytics Dashboard (Overview)
Section titled “Analytics Dashboard (Overview)”- When you open Analytics, you land on the Analytics Dashboard.
- At the top, you will see:
- Website tab (traffic data)Revenue tab (earnings data)Open detailed view (advanced analytics)
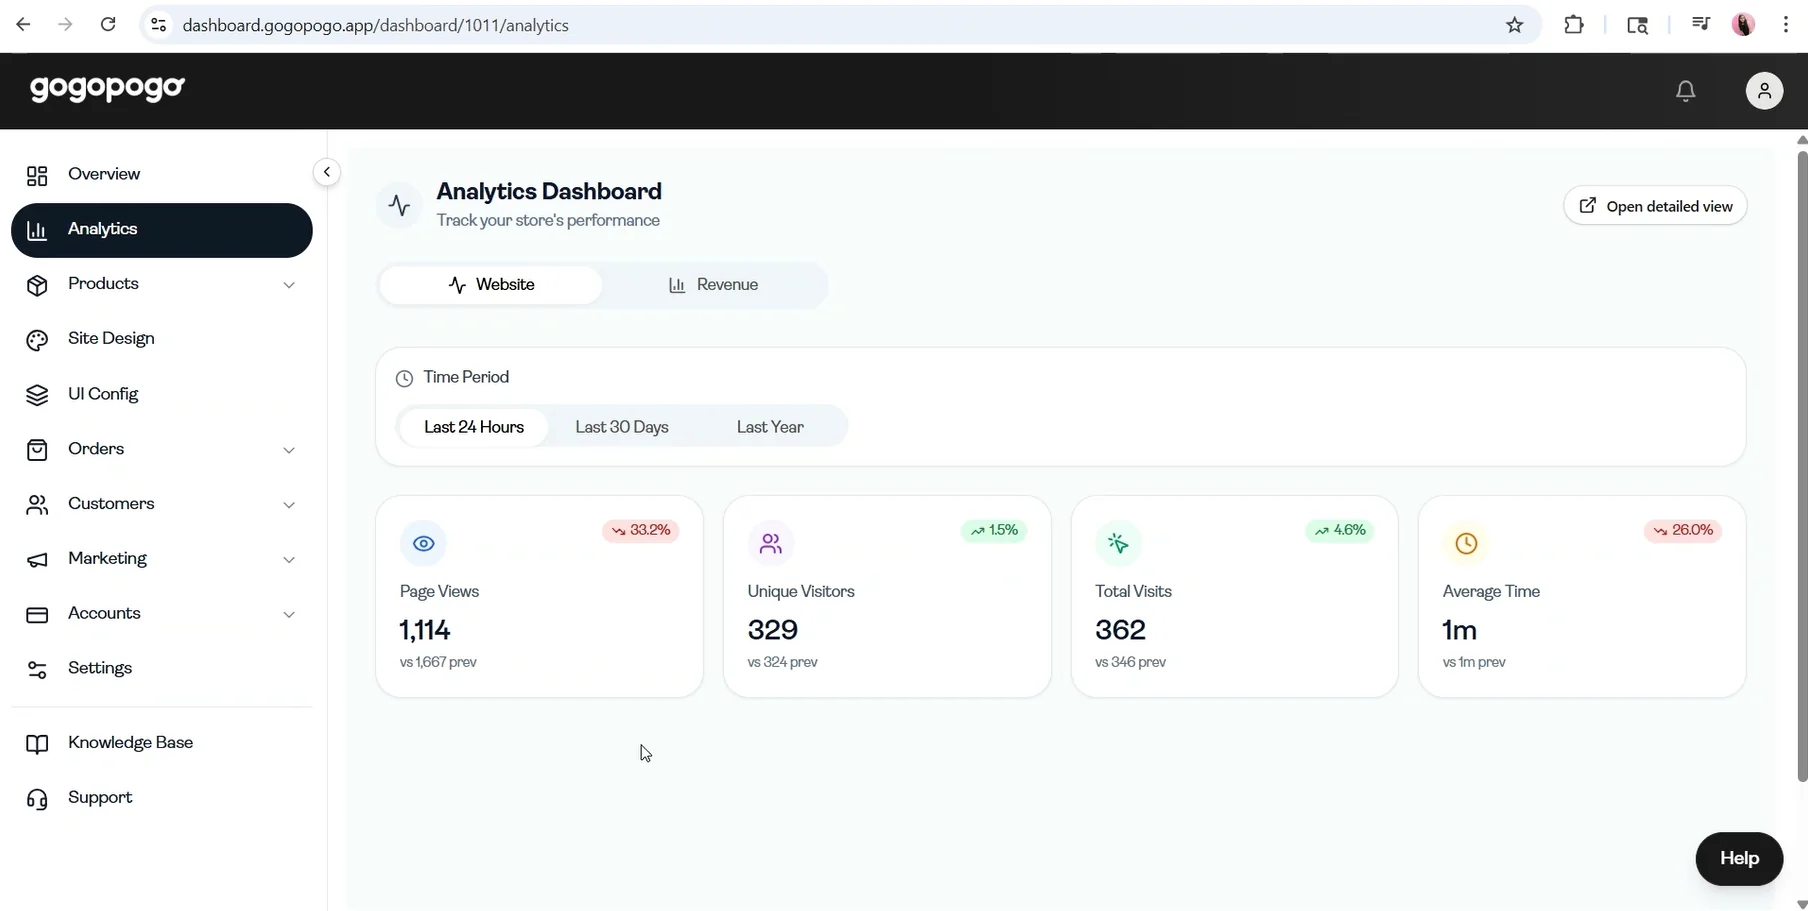
Website Section (Traffic Data)
Section titled “Website Section (Traffic Data)”- By default, the Website tab is selected.
- Here, you will see time period filters:
- Last 24 HoursLast 30 DaysLast Year
- Below that, key metrics are shown:
- **Page Views -Total number of times your store pages were viewedUnique Visitors -Number of individual users visiting your storeTotal Visits -Total number of visits including repeat usersAverage Time -**Average time users spend on your store
- Each metric also shows increase or decrease compared to previous data.
Revenue Section (Earnings Data)
Section titled “Revenue Section (Earnings Data)”- When you click on the Revenue tab, the dashboard updates.
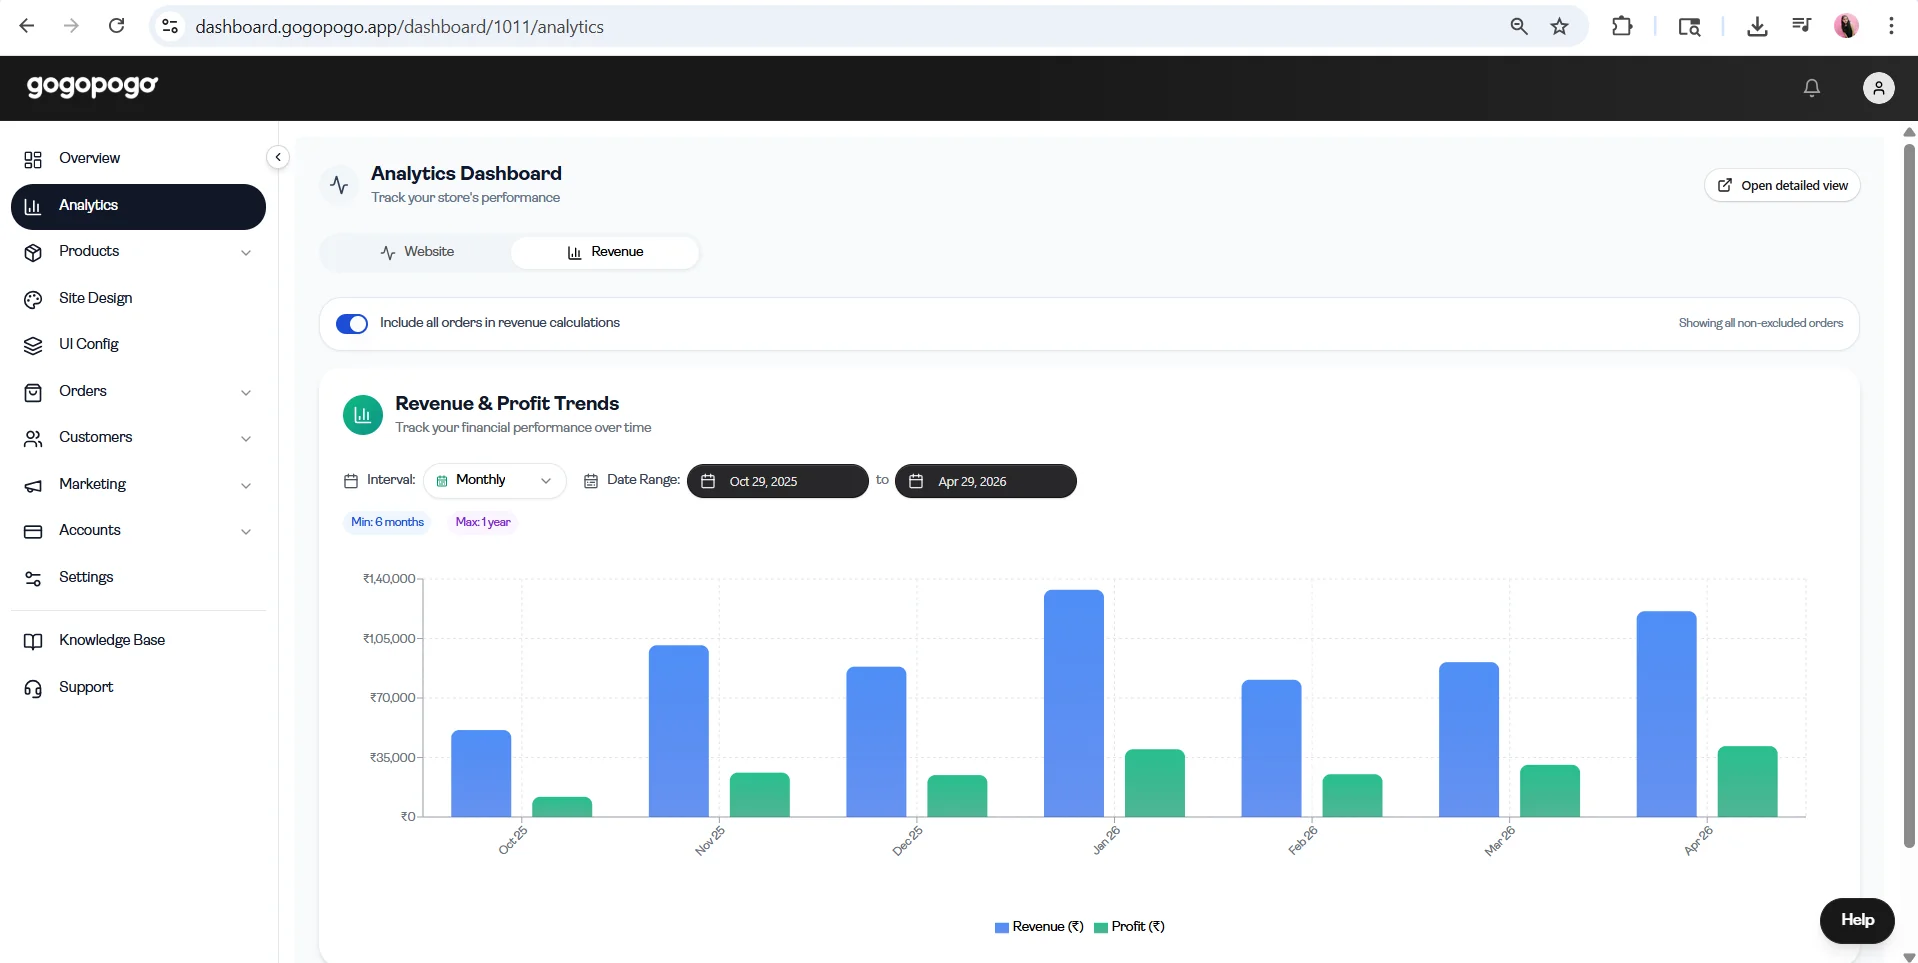
- You will see:
- Include all orders in revenue calculations (toggle) -Controls whether all orders are counted in revenueRevenue & Profit Trends graphBlue bars → RevenueGreen bars → Profit
- Above the graph, options available:
- Interval (Daily, Weekly, Monthly)Date Range selectorLimits like Min 6 months / Max 1 year
- This helps you track your earnings over time.
Detailed Analytics View
Section titled “Detailed Analytics View”- On the top right, click Open detailed view to access advanced data.
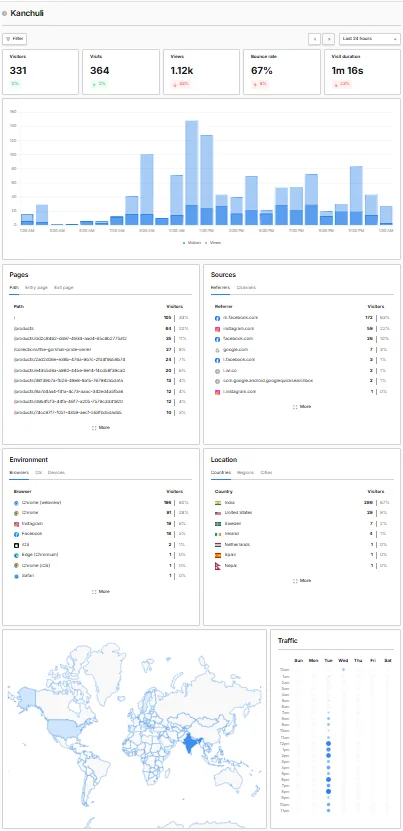
- At the top of this page:
- Filter option****Time selection (e.g., Last 30 days)
- Key metrics displayed:
- VisitorsVisitsViewsBounce RateVisit Duration
- Below, multiple sections are available:
- **Graph Section -Shows traffic trends over timePages Section -Shows top pages and their visitorsSources Section -Shows where users are coming fromEnvironment Section -Shows device and browser detailsLocation Section -Shows visitor countriesWorld Map -Visual traffic distributionTraffic Activity -**Shows activity by time
Important Notes
Section titled “Important Notes”- Use Website tab to understand traffic and engagement
- Use Revenue tab to track earnings and profit
- Use Detailed View for deeper analysis of users and sources